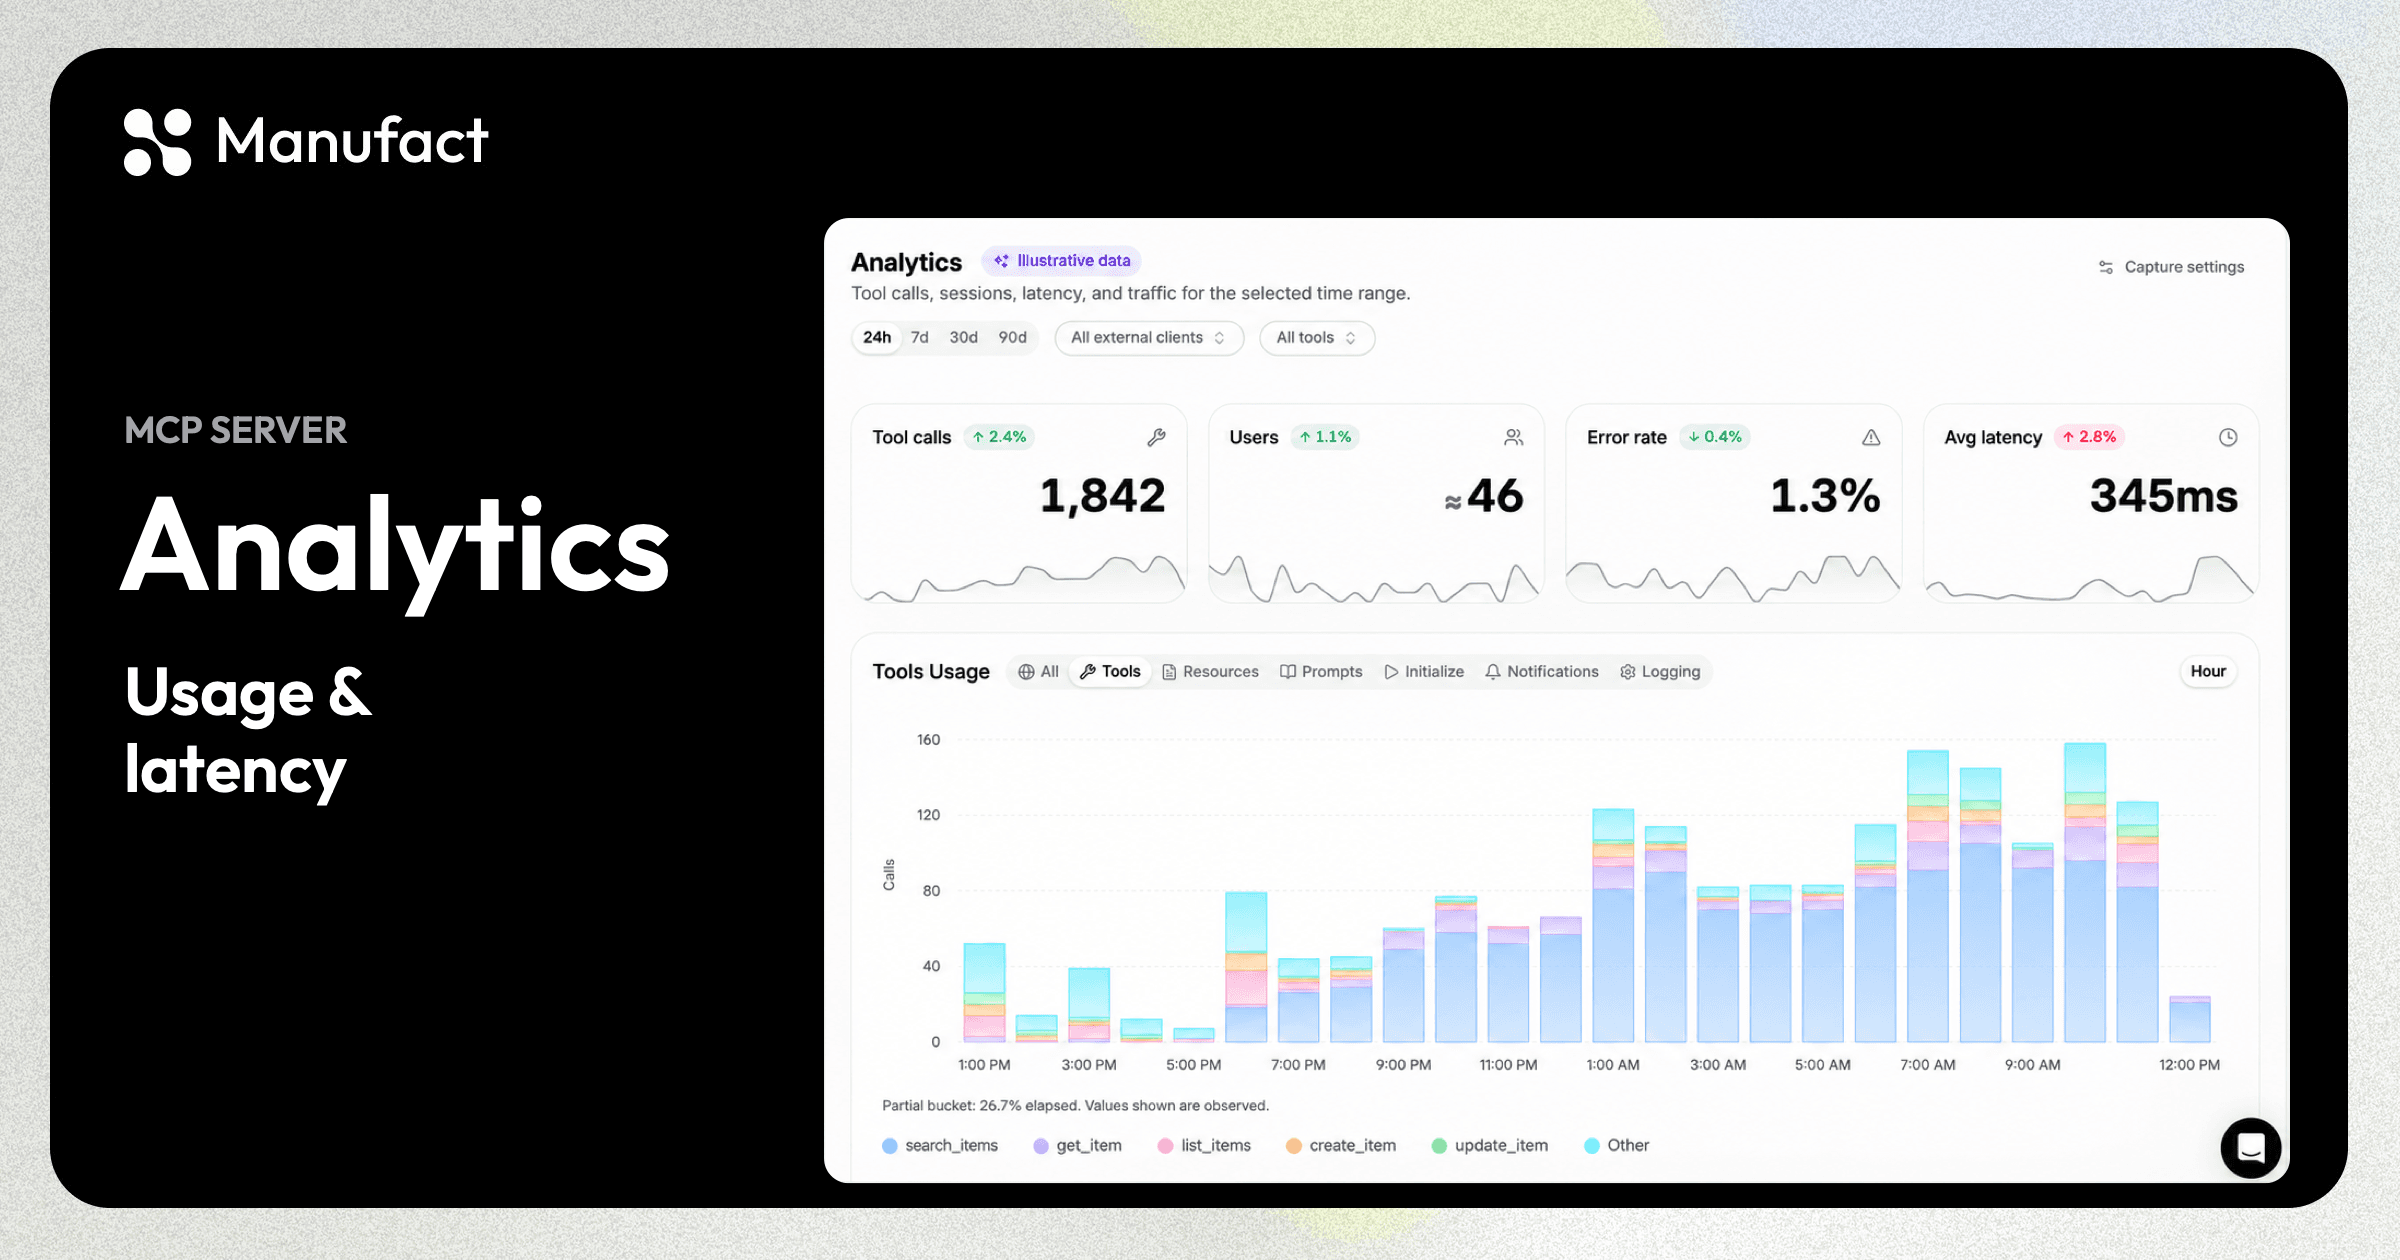
Use Manufact Analytics to find which tools agents use, where latency increases and which tools fail. Start with usage and per-tool latency, then open affected sessions to identify what to fix. After a change, test the task in the affected client and compare production results.
Analytics measures traffic through the Manufact gateway. Use it with a Manufact-hosted server. If you need Analytics while keeping your existing infrastructure, contact our team about an Enterprise setup. Calls that bypass the gateway aren’t measured.
Quality affects discovery
OpenAI’s plugin guidelines say plugins with strong real-world utility and high user satisfaction may qualify for enhanced distribution, including directory placement or proactive suggestions. The same guidelines call for reliable, responsive behavior and clear error handling.
Anthropic says a connector’s review label affects how users discover it in the Claude directory. For Verified connectors, Anthropic tests tools for quality and compatibility.
For your team, the work continues after submission. To ensure excellent user (and agent) experience: find the tools people use, investigate slow calls and check whether users complete the tasks you built for.
Review usage and latency in Analytics
Check tool usage and client activity
Choose a review window in your server’s Analytics tab. Start with the summary: tool calls, sessions, request error rate and average latency. Then look at individual tools before deciding where to spend engineering time.
A rise in calls can come from an agent retrying the same task. Compare the change with account activity and inspect sessions before treating it as adoption. A tool with little traffic may need a clearer description, or it may serve an uncommon task. The count alone won’t tell you which.
Manufact Analytics covers tools, resources, prompts, initialization and notifications. You can break client activity down by client, version or protocol, and inspect request geography by country and client.
Use the Users view to follow account and token identities across sessions. Treat these as identities, rather than a count of unique people. Compare active identities, sessions per user and calls per user to understand how usage changes.
Find slow calls with p50, p95 and p99
An agent may need several tool calls to finish a task. When those calls depend on one another, the user waits through each one. A slow call in the middle of that sequence can make the whole interaction feel slow.
Start with latency by tool. A server-wide average blends different operations and can hide the slow requests you need to investigate. In Manufact Analytics, you can compare p50, p95 and p99 by tool and client.
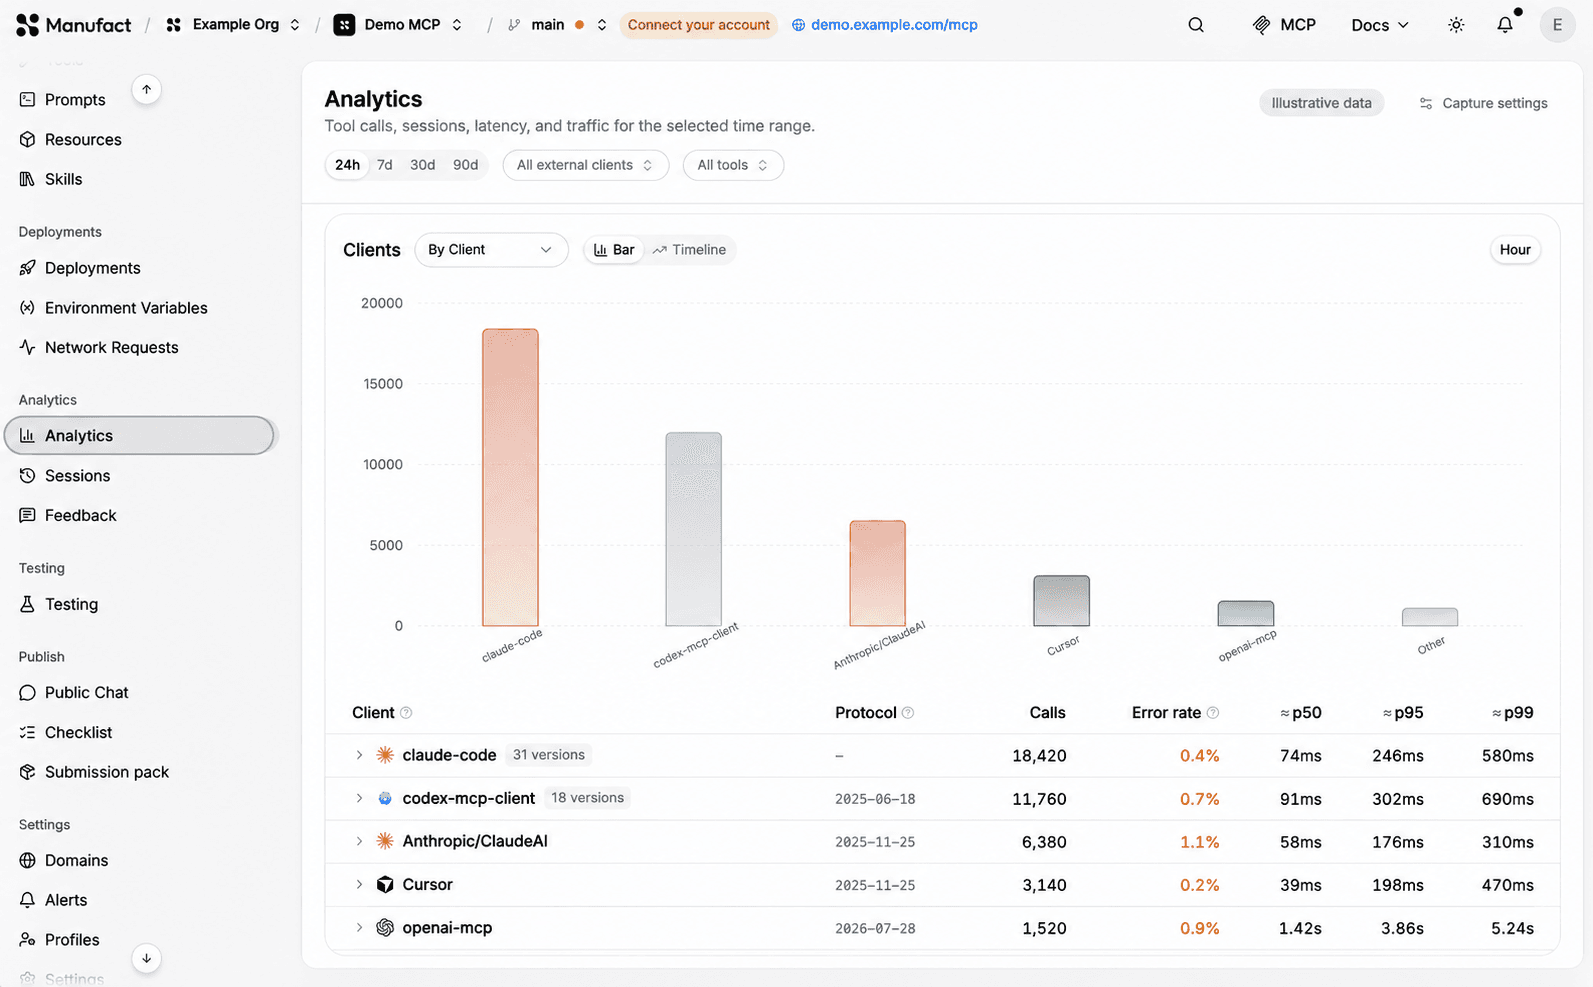
Illustrative data. Server and organization identities anonymized; metrics randomized.
-
p50 is the median: half of the measured calls take this long or less.
-
p95 marks the duration at or below which 95% of calls fall. Use it to examine the slower end of the distribution.
-
p99 reaches further into the tail. Check the request count before drawing conclusions from a small sample.
Analytics marks percentiles as estimates. The Tool latency card charts p95 over time, compares tool medians with the previous period and shows p95/p99 markers. Click a tool’s bar to open matching sessions and inspect a timeline.
Use that view to guide an investigation:
-
Choose a tool with slow calls that affect a workflow your users need. Consider its traffic as well as its duration.
-
Compare the same tool and client over comparable periods. Check whether a change in workload could explain the difference.
-
Open affected sessions. Inspect the calls around the slow operation and the available request and response detail.
-
Reproduce the task in the affected client. After a fix, compare the same measurements and confirm that the task still succeeds.
Keep the measurement boundary clear. Gateway request duration covers the MCP request. The user’s full wait can also include model generation, client behavior and other tool calls. Use a client test when you need to assess the full interaction.
Check output size
Analytics estimates average output tokens for tools, prompts and resources when Capture payloads is enabled. Use the comparison between definition size and response size to find tools worth inspecting.
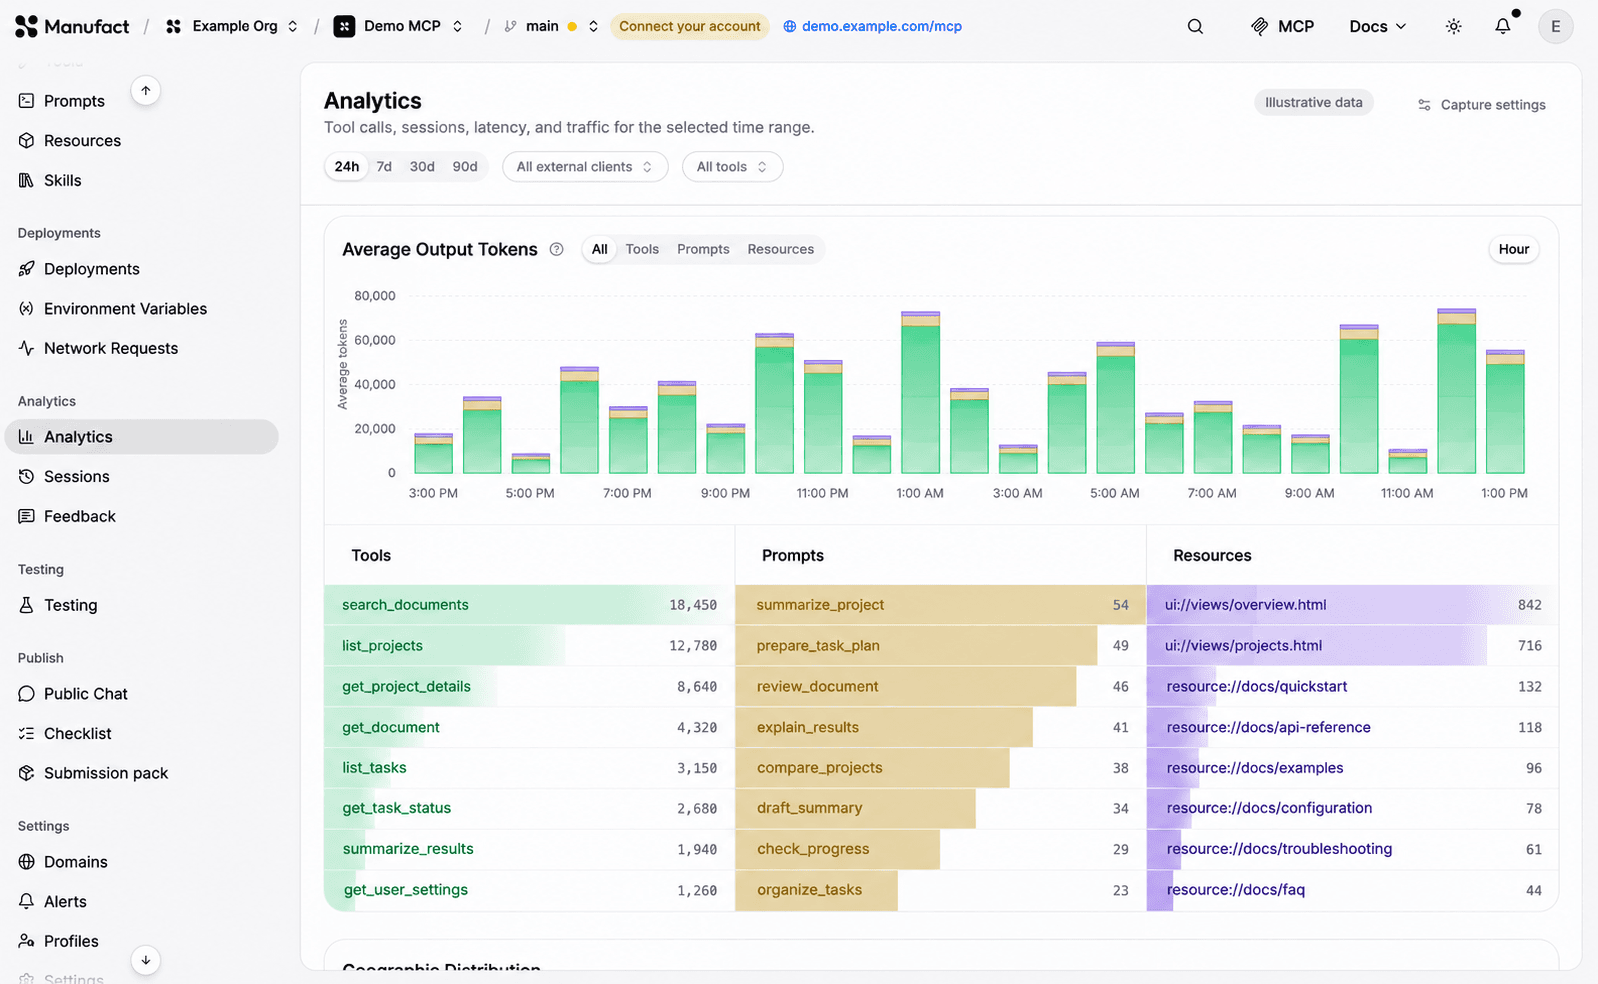
Illustrative data. Server, organization, tool, prompt and resource identities anonymized; metrics randomized.
Read a large response before shortening it. Remove repeated or irrelevant content, then test whether the agent can still complete the task. A smaller response that leaves out a required field creates a different problem.
Trace errors to task outcomes
Separate request failures from tool errors
A successful HTTP exchange can contain a failed tool result. In Analytics, use the per-tool health view to compare request error rate with tool result error rate, then inspect the affected sessions. Our MCP hosting guide covers how these checks fit into operating a deployed server.
Use Issues to review recurring tool, JSON-RPC and transport errors. Expand a group to read a sample message and open affected sessions. You can resolve or ignore an issue, and reopen it when it needs attention.
Prioritize the failure by its effect on the task. An agent may recover after a retry, while another error may block the workflow. Read the sequence before deciding that a request-level fix has solved the user’s problem.
Inspect the session and outcome
From a card in Analytics, open the sessions associated with a tool or client. In the session timeline, you can follow initialization, tool listing, calls and errors in order. With payload capture enabled, you can also inspect stored request and response bodies.
Look for the first point where the interaction differs from the intended workflow. Check the tool the agent chose and whether its arguments fit the schema. Follow any retries after an error. Use the evidence to choose the next test.
In Goals, review AI-discovered or manual tasks with Achieved, Failed or Unknown outcomes. The view needs enough tool-call sessions to show trends; no payload capture is required.
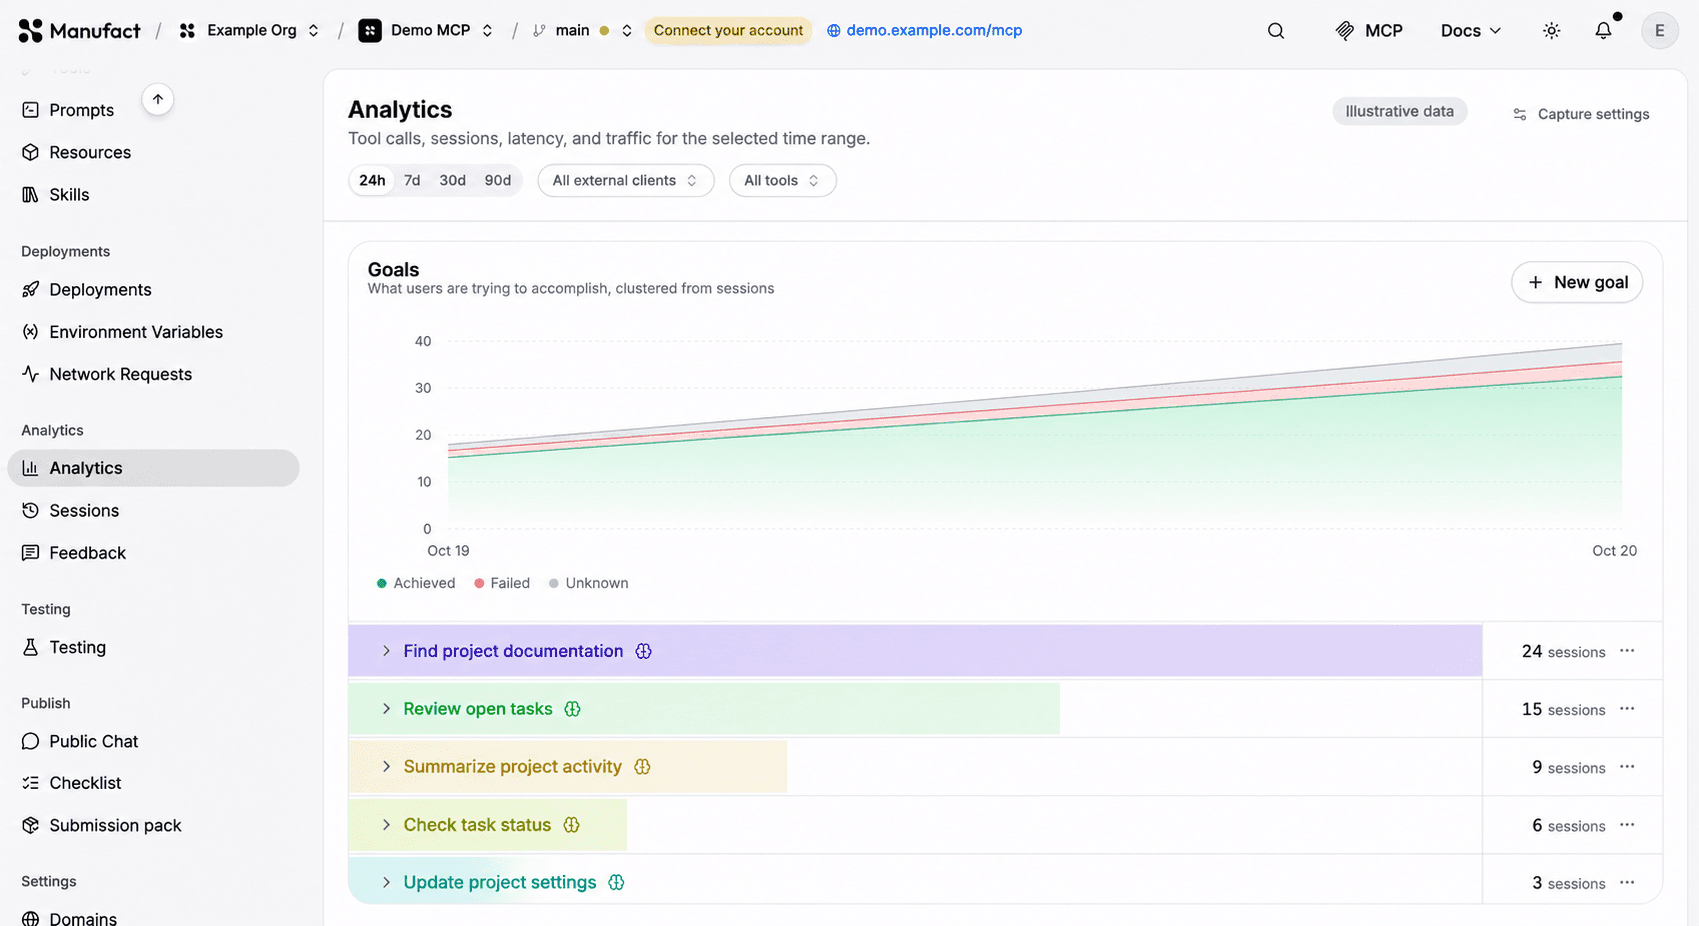
Illustrative data. Server, organization and goal identities anonymized; metrics randomized.
Review a label against the session evidence before using it to make a product decision. You can override a goal or outcome in the timeline. Keep Unknown when the available evidence doesn’t establish what happened.
Connect your server to Analytics
Analytics measures gateway traffic without an analytics SDK. If you keep your existing hosting, contact our team about an Enterprise setup to connect your existing MCP server.
For an Enterprise setup with an externally hosted server, follow these steps after our team confirms the configuration:
-
Open Servers → New Server and choose Connect an existing server. Enter the HTTPS MCP endpoint and complete authentication if required.
-
In the server’s Settings, select Upgrade to Manufact proxy to create a Manufact gateway URL.
-
Configure the clients you want to measure to use that gateway URL. Test authentication and a representative task after switching.
Connecting an endpoint for testing and publishing does not enable Analytics. The Enterprise setup must route client traffic through the Manufact gateway. Calls sent to your upstream endpoint bypass Analytics. Usage follows your Enterprise agreement.
Choose your capture settings
Review Analytics capture settings before storing request or response bodies. Tool arguments and results can contain customer data.
Capture payloads enables stored bodies, richer error context and token estimates. Identify actors is a separate setting for available names and emails. It’s off by default, and its labels depend on the server’s authentication setup. Use the collection settings that fit your users and data-handling requirements.
Test the fix and compare results
Take one affected workflow into Manufact Testing. Define the task and passing criteria, add relevant tool assertions, and run it in the clients you support. Review the tool-call sequence alongside the result.
If the workflow includes an MCP App, test in a client that renders the UI. A passing coding-agent run doesn’t establish whether the screen works. Include concrete visual requirements when the interface matters.
For a failure that appears in one client, use our guide to MCP servers that work in Inspector but fail in ChatGPT or Claude. Compare the same endpoint and account, then identify the first step where the runs diverge.
After you ship the change, review the affected tool’s duration and task outcomes over a comparable production window.
FAQ
Can I see a user’s full ChatGPT or Claude conversation?
Analytics records the MCP interaction with your server. It doesn’t provide the user’s full chat history. Session timelines show MCP events and, when you enable capture, stored payloads. Treat recorded intent summaries as context from the session, not a transcript of everything the user said.
Do I need to rewrite my server with mcp-use?
No. Analytics supports servers built with other MCP SDKs without rewriting the server or its OAuth implementation. If you keep your existing infrastructure, contact our team about an Enterprise setup. Route the traffic you want to measure through the Manufact gateway.
How often does Analytics refresh?
While the tab is open, the 24-hour view refreshes every 30 seconds, the 7-day view every 2 minutes and the 30-day view every 10 minutes. Reload the 90-day view to update it.
Start with one tool your users depend on. Connect its traffic to Manufact, review latency and errors, and open an affected session. Connect your server to begin.